Daniel Joseph Oliver

NANOGrav Physics Frontiers Center Postdoctoral Fellow at Oregon State University

Publications

What Fraction of Extreme Mass Ratio Inspirals That Merge After the LISA Mission Ends Are Detectable?

D. J. Oliver, A. D. Johnson, J. E. Thompson, C. J. Cutler, 2026

Submitted, Physical Review D

arXiv:2609.36298

NASA ADS

Citations: loading…

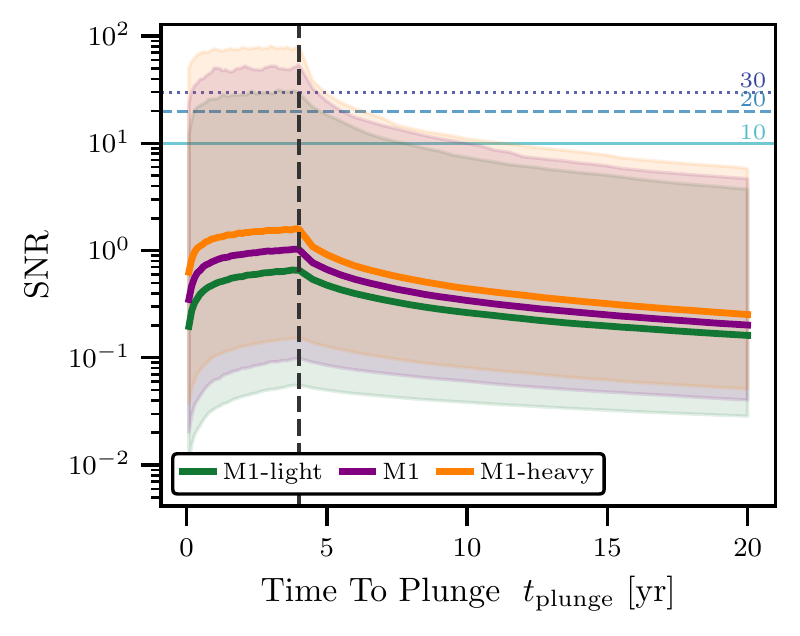
Median SNR and 5-99% band against time to plunge
(a) Median and 5–99% TDI-SNR band
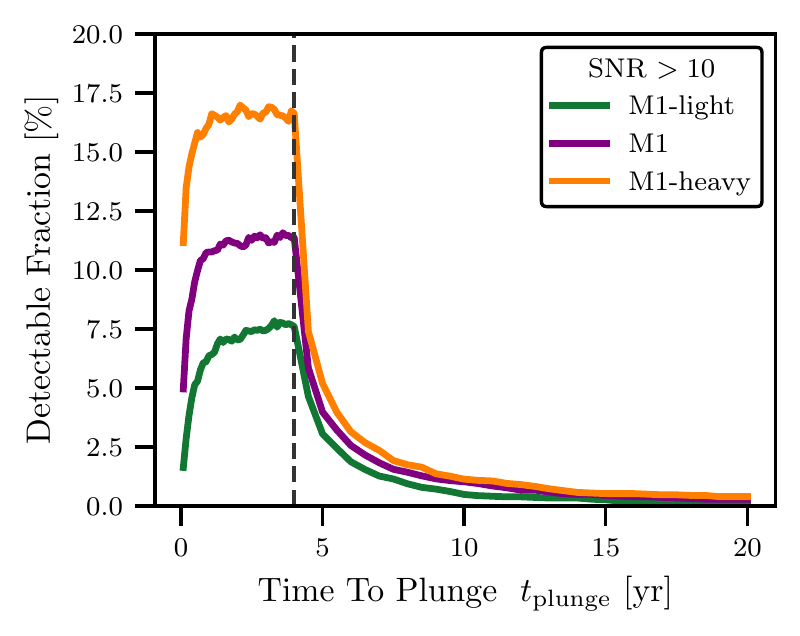
Detectable fraction against time to plunge
(b) Detectable fraction
Secondary-mass sensitivity at a = 0.998 cos ι, over the four-year mission with 4000 sources per node. Both panels show M1-light (m = 5 M☉), M1 (m = 10 M☉), and M1-heavy (m ~ U(10, 30) M☉) against time to plunge. (a) shows the median SNR and its 5–99% band for the four-year mission. (b) The detectable fraction at ρ > 10, the threshold at which all three populations retain a visible far tail, with the same ordering at ρ > 20 and ρ > 30.

Constraints on Supermassive Black Hole Binaries from the Lack of Resolvable Sources in the NANOGrav 15-yr Dataset

E. C. Gardiner et al. (119 authors including D. J. Oliver)

Submitted, The Astrophysical Journal

arXiv:2609.32306

NASA ADS

Citations: loading…

The NANOGrav 15 yr Data Set: Impacts of Customized Chromatic Noise Models on Gravitational Wave Analyses

N. Agarwal et al. (123 authors including D. J. Oliver)

Submitted, The Astrophysical Journal

arXiv:2606.28554

NASA ADS

Citations: loading…

Mitigating the Timing Impact of Anomalous Pulse Profile Shape Variability in PSR J1713+0747 with Gaussian Component Modeling

S. A. Nichols et al. (34 authors including D. J. Oliver)

Accepted, The Astrophysical Journal (in press)

arXiv:2607.12038

NASA ADS

Citations: loading…

Directional Anisotropic Sensitivity Curves for Pulsar Timing Arrays

D. J. Oliver, J. S. Hazboun, M. Maggi, J. G. Baier, K. E. Gourlie, 2026

Classical and Quantum Gravity

arXiv:2608.00250

NASA ADS

Citations: loading…

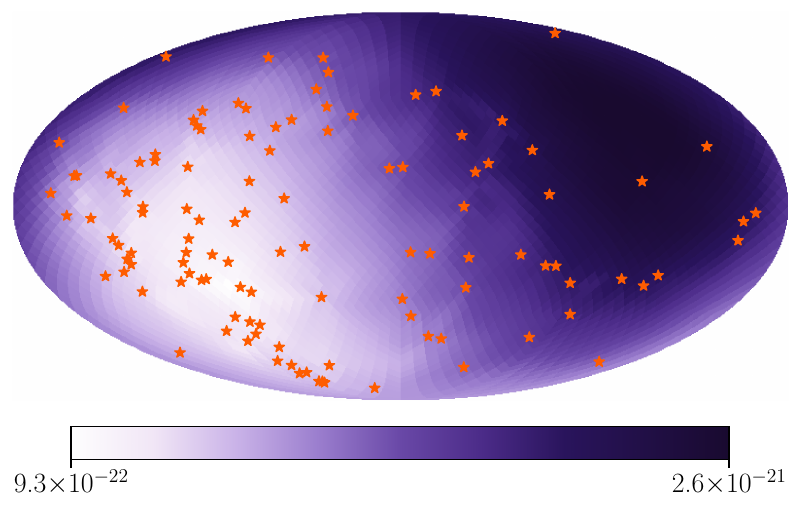
Radiometer effective sensitivity skymap
(a) Radiometer Seffrad
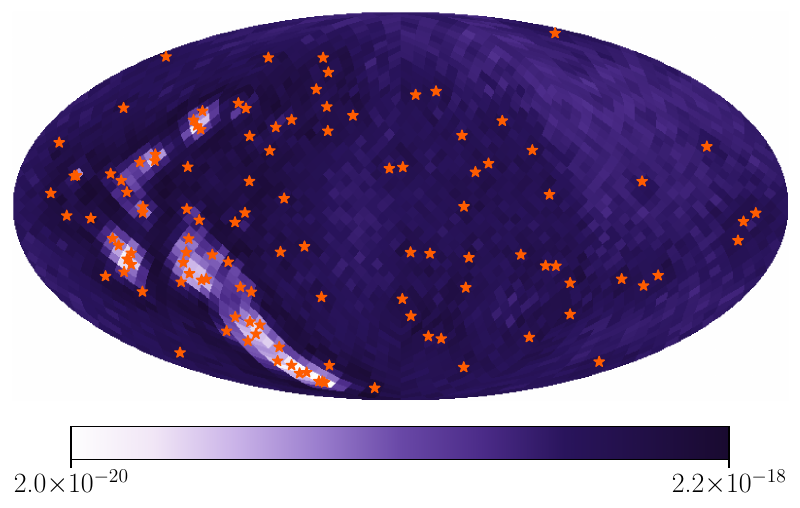
Full-Fisher effective sensitivity skymap
(b) Full Fisher Sefffull
Ratio of full-Fisher to radiometer effective sensitivity
(c) Ratio Sefffull / Seffrad
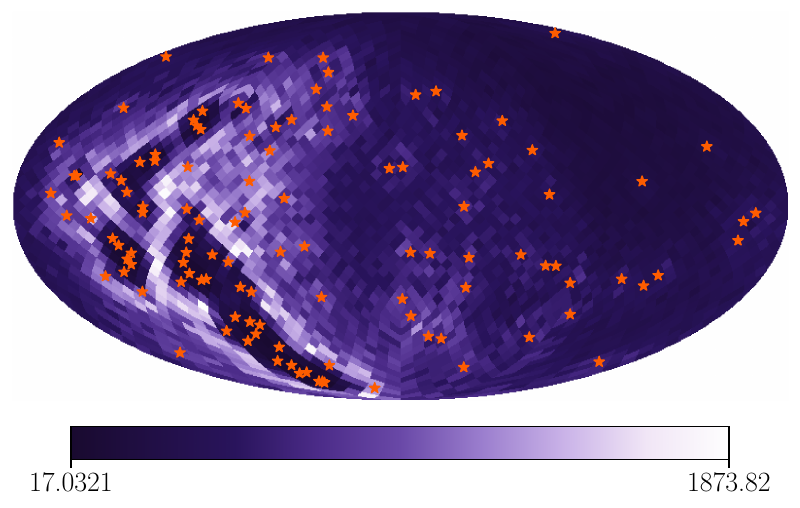
Per-pixel effective sensitivity Seff at the peak sensitivity frequency (f ≈ 8.54 nHz) for the 16-year SPTA. (a) shows the diagonal radiometer Seffrad. (b) shows the full-Fisher Sefffull. (c) shows the ratio of the full-Fisher to the radiometer, which reflects the over-parameterization of the pixel basis relative to the array’s ~ℓeff2 independent modes.

Pulsar Timing Array Sensitivity to Anisotropy: Empirical Sensitivity Curves, Scaling Relations, and the Multi-resolution Pixel Basis

T. T. Moursy et al. (118 authors including D. J. Oliver)

The Astrophysical Journal

arXiv:2608.09781

NASA ADS

Citations: loading…

The NANOGrav 15 yr and 20 yr Datasets: Timing Events and Pulse Shape Changes

B. Jacobson-Bell et al. (64 authors including D. J. Oliver)

The Astrophysical Journal

arXiv:2604.05453

NASA ADS

Citations: loading…

The NANOGrav 15 yr Data Set: Customized Chromatic Noise Models

B. Larsen, J. G. Baier, D. J. Oliver, K. Wayt, Y.-T. Chang, J. S. Hazboun, C. M. F. Mingarelli, et al. (56 authors), 2026

The Astrophysical Journal

arXiv:2606.28571

NASA ADS

Citations: loading…

The NANOGrav 12.5-year Data Set: Chromatic Noise Characterization & Mitigation with Time-Domain Kernels

J. S. Hazboun, J. Simon, B. Larsen, J. Baier, D. J. Oliver, et al. (67 authors), 2026

The Astrophysical Journal

arXiv:2511.22597

NASA ADS

Citations: loading…

Gravitational Wave Peep Contributions to Background Signal Confusion Noise for LISA

D. J. Oliver, A. D. Johnson, L. Janssen, J. Berrier, K. Glampedakis, D. Kennefick, 2026

Physical Review D

arXiv:2507.19704

NASA ADS

Citations: loading…

Peep Backgrounds
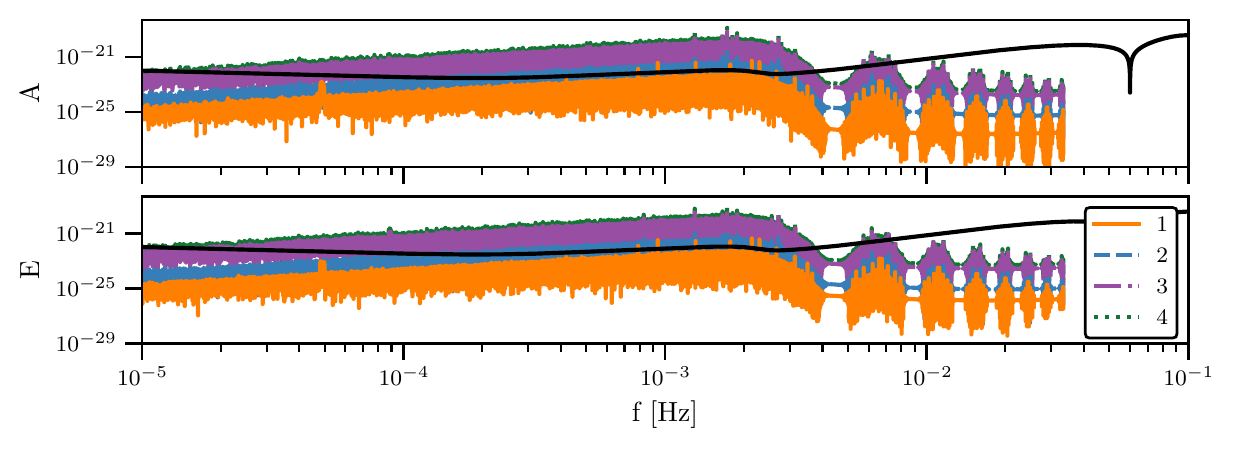
Stochastic background from gravitational wave peeps showing the total signal of from three different assumptions of population rates plotted over the LISA sensitivity curve for the A and E channels.

Gravitational wave peeps from EMRIs and their implication for LISA signal confusion noise

D. J. Oliver, A. D. Johnson, J. Berrier, K. Glampedakis, D. Kennefick, 2024

Classical and Quantum Gravity

arXiv:2305.05793

NASA ADS

Citations: loading…

Full EMRI waveform
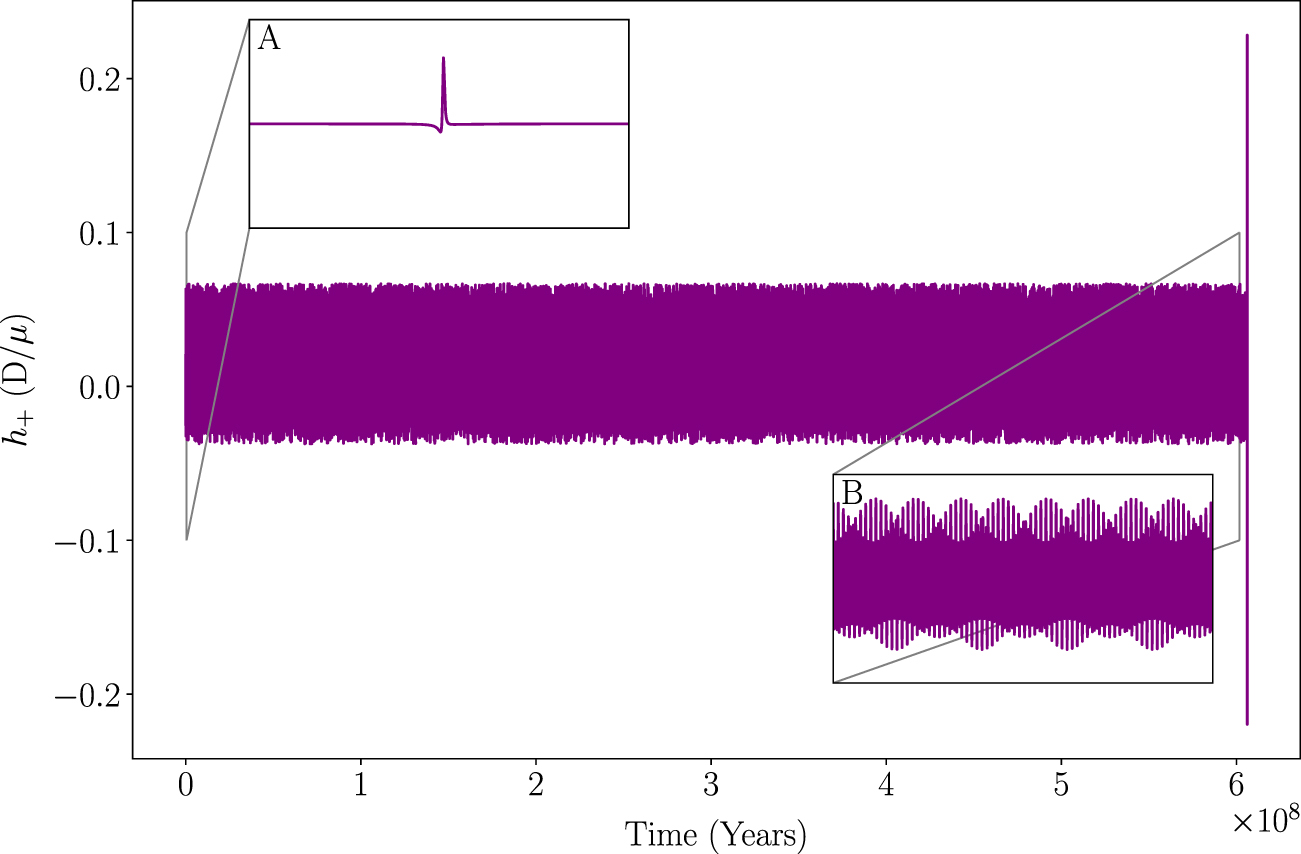
Fully modeled EMRI from capture to merger modeled using a numerical kludge code (a = 0.8M, p = 119.999916M, e = 0.9999981). This waveform shows that there is very little amplitude evolution over the full inspiral until just before merger. This is due to the apoastron distance decreasing with each recurring burst of gravitational waves, and it isn't until the orbit is nearly circular that the periastron changes thus causing the amplitude evolution.